| Read More |
| Big Data and Predictive Analysis |
|
Why an HAI Dashboard? |
|
HAIvia Dashboard in Slides
|


|
"HAIvia" Explained We borrowed the HAI (healthcare-associated infections) term and combined it with "via" for "visual analysis" as HAIvia presents critical decision support information visually allowing healthcare and environmental services personnel to easily and quickly analyze data and spot trends for the best possible patient outcomes and cost savings. |
 Monitoring and Managing your Environment through an Integrated Dashboard for Maximum Infection Prevention and Cost Control
Here are a few capabilities our integrated HAIvia Dashboard can provide.
| Explore: See your facilities HAI rates, and HAC and HCAHPS scores. With human resource integration, view the training status and CDC inspection audits of your cleaning professionals. With integrated facilities management, see utilization rates at a glance. | Monitor/Analyze: Set your own specific thresholds for HAI rates, quality inspections and more and quickly spot issues with color-coded warnings. Compare your facility to system level performance. | Act: Assign staff to training for corrective action for improved infection prevention. With better facilities and inventory monitoring, experience increased efficiencies. |
The dashboard presents visual and numeric summaries of information about selected hospital or facility units. This includes HAI standardized infection ratios, HCAHPS/HAC scores, departmental data, and more. A familiar navigation tree allows users to easily view staff reporting structure and select a specific facility to monitor their key performance indicators (KPI).

Illustration: The Unit Reporting Structure Tree and the summary view of unit performance.

Illustration: When a unit is selected, the tile view shows key metrics with color-coding for quick reference. You can select tiles to drill down into more detailed information. The green tiles represent acceptable performance and red tiles represent unacceptable performance based on your threshold settings.
Compare and Monitor SIR Numbers in Graphic Form
Review the select hospital's CMS rates and scores for C.diff., MRSA, SSAColon, and more. Any company internal performance metrics can be integrated as well and shown graphically over time. Select a tile to easily drill down for more detailed analysis. Compare how a single hospital unit performs against the hospital system as a whole or by region or hierarchy.

Illustration: Key Performance Indicator information can be presented in various chart formats. Format can be customized by DocuFi to your specifications: bar, pie, scatter, etc.
Illustration: The training progress interface lets managers see employee progress and enroll employees in online classes. Enrollment can be automatic through a proficiency testing mechanism or accomplished manually through a few clicks of the mouse to individualize training.
Here are a few of the possibilities for environmental services housekeeping staff integration.
- View historical training from your existing system and progress through the HAIvia Dashboard online learning.

- Automatic enrollment in the appropriate class based on failed inspections. Learn more about inspection information which can be tracked by the dashboard, if available below.

Managing Cleaning Staff Performance: Integrating Inspection Audits
Do you test your environment with black lights by either in-house staff or a third-party? Do you perform other quality inspections? With your human resources data and inspection data integrated, mangers can review housekeeping staff performance quality as related to inspection audits. Easily review entire teams with simple and intuitive overviews and precise audit reporting. Review overall performances and month-to-month inspection audits. Take action on the information and automatically direct staff to online learning classes or videos for refresher training.

Illustration: Select an individual housekeeper to view month-to-month inspection in the right panel and drill down for further information on failed inspection items and training.
Audit Pass Fail Review

Illustration: Use the Pass/Fail slider to quickly identify staff failing at a designated threshold. Click on an employee name for more detail.
Black Light Inspection Example:

Illustration: Inspection data, from sources such as black light inspections, can be presented to highlight trends and deficiencies. Failure thresholds can be implemented to automatically direct the employee to retraining via online learning or video tutorials.
Facilities Management Integration
DocuFi can effectively help you manage your hospital and medical facility physical space by incorporating your computer-aided design (CAD) drawing files and environmental services information into the DocuFi/CAFM solution. Integrating partner software from Simple Solutions FM, CAFM Resources and UndergroundGIS, our integration solution allows you to assign space classes which can be used for infection prevention analysis, reimbursement, cleaning management, and asset and inventory management as well as help you manage the underground lifeline to your facility. Integration of infection disinfectant system data through our HAIvia Mobile platform can provide you with actionable infection prevention. This data, collected from UV disinfection and vaporized hydrogen peroxide disinfection equipment, can assist you with decisions on how the equipment should be used and where infection problems are manifesting. Our integration services can transform the space management data into a visual, interactive tool to guide decision makers with the HAIvia Dashboard.

Illustration: Facilities data can include floor plan information, room classification, disinfection equipment data analysis, equipment inventory and more.
Purchasing Integration
Purchasing data can be integrated with the HAIvia Dashboard for quick access to information such as part numbers, Material Safety Data Sheets (SDS) and manufacturer contact details. Additionally, purchasing trends can be tracked with the dashboard's graphic capability.


Illustration: Purchasing data can be viewed by category and by month. The flyout offers specific product information, email to the manufacturing representative, and an internet search for the Safety Data Sheet for the selected item.
HAIvia Mobile for Easy Data Capture and Integration

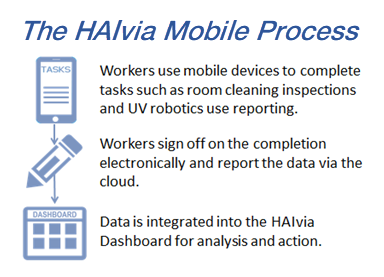 HAIvia Mobile can save time, reduce costs, and eliminate paper and data entry errors by automating capture of task-related forms and reporting. Combining HAIvia Mobile with HAIvia Dashboard offers detailed analysis of the data providing actionable information to help you in the fight against healthcare-associated infections (HAIs) and increase your Hospital Value-Based Purchasing incentive payments.
Common, familiar mobile graphical interface features such as touchscreen entry and scroll data selection practically eliminate the need for application user training. Learn how HAIvia Mobile can easily capture cleaning staff inspection audits, UV or misting disinfection discharge events, room discharge notices, bed turnover inspections, room classification updates and more.
Other Integrations to the Dashboard
Take the HAIvia Dashboard even further and integrate other key information such as inventory and budgeting. If the information is available from a database feed, we can link your key performance indicators and give you instant access with alerts, tracking, and reporting.
Infection Prevention Resources
Check out articles, videos, forums, and tips for infection prevention, HAIvia products and HAI control. Learn about infection statistics, environmental services cleaning and high-touch surface cleaning topics, and more
![]()