|
Watch the SlideShares
|

 |
|
Download our most popular solution for your document processing needs. You'll get a free version of ImageRamp Composer, a trial of ImageRamp Batch plus several fully functioning Free tools to produce OCR'd PDF, Create Barcode Separation Sheets, assemble PDF files and Validate barcode splits. |
20 Tips to Solve Common Problems Reading Barcodes
Learn from these 20 tips and improve your barcode processing issues.
Within document imaging, barcodes indisputably provide a highly accurate way of providing information for intelligent processing of documents such as splitting, naming, and routing files and indexing. DocuFi’s ImageRamp Batch easily uses barcode information as described. This article describes some common issues with barcode images and suggests some possible solutions which may be available to optimize barcode recognition.
Jump to:
Preprocessing Tips for Improved Barcode Recognition
The best barcode recognition starts with setting the highest standards for your forms and scanning workflow if it's within your control.
Tip 1: Set standards for pixels per element in your barcoded forms. For 1D barcodes use at least three pixels as the minimum bar length. For 2D use modules of 4 or 5 pixels.
Tip 2: Don't use variable length barcodes as you can’t guarantee accurate recognition if many elements are squeezed into a fixed area. If you do have to have variable length information, set a maximum size and account for that size on your document.
Tip 3: Do not locate barcodes on forms where they may be stapled or clipped which can lead to damage.
Tip 4: Design your forms with plenty of white space around barcodes, optimally ¼ inch.
Tip 5: Scan your documents with at least 300 dpi. For lower dpi scans, test to determine the lowest acceptable resolution.
Tip 6: If possible, orient 1D barcodes horizontally on your forms as most scanners are likely to pull the paper through the scanner from the shorter side. This orientation is the least affected by slippage during the scan which can distort the barcode image.
Tip 7: Do not use forms with colored background.
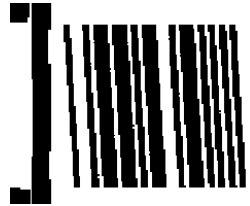
Skewed Barcode
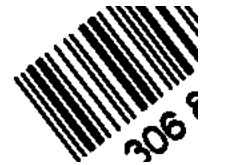 ImageRamp can read many skewed barcodes using default settings, but some barcodes may require the adjustments to the barcode settings.
Tip 8: Try setting SkewTolerance to a value between 1 and 5. SkewTolerance controls the maximum angle from the horizontal or vertical at which a barcode will be recognized by the toolkit.
Tip 9: You may also need to decrease the value of SkewLineJump to a value such as 1 though this will slow down the recognition speed. The SkewLineJump property controls the frequency with which the toolkit samples scan lines as it moves through an image. Increasing the value of the LineJump property will increase the speed at which an image is processed but may decrease the read rate.
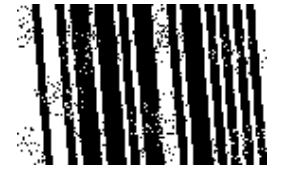
Noisy Background
 With this problem, the entire image will typically contain black dots in the background.
Tip 10: Try setting the NoiseReduction to a value between 5 and 10. If a value is specified in this setting, the toolkit will run an image through a noise reduction filter and remove marks that are unlikely to be part of a barcode before interpreting the barcodes. Use caution with larger values in this setting as larger values remove larger marks from the image which could destroy vital barcode information.
Tip 11: Try setting the MedianFilter. When this setting is set toTRUE, the toolkit will apply a median filter to the image before checking for barcodes. This is a useful option for high resolution images that contain speckles of black and white. It is not recommended for images where the black bars or white spaces are less than 2 pixels wide.
Tip 12: Try the UseOverSampling setting. When UseOverSampling is TRUE the barcode reader samples 3 lines at a time (skipping 2 lines between each sample) and takes the average pixel value. This is useful for images containing both black and white speckles.
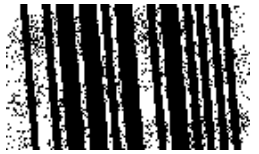
White Speckles in the Bars
 In this case the image will typically contain black dots in the background and white dots in the black bars.
Tip 13: Try setting NoiseReduction to a value between 5 and 10 and Despeckle to True.
Tip 14: Try setting the MedianFilter. When this setting is set toTRUE, the toolkit will apply a median filter to the image before checking for barcodes. This is a useful option for high resolution images that contain speckles of black and white. It is not recommended for images where the black bars or white spaces are less than 2 pixels wide.
Tip 15: Try the UseOverSampling setting. When UseOverSampling is TRUE the barcode reader samples 3 lines at a time (skipping 2 lines between each sample) and takes the average pixel value. This is useful for images containing both black and white speckles.
Badly Defined Bar Edges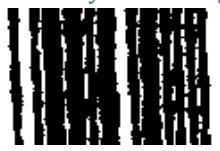
In these cases the bars have joined together in certain places, which makes it difficult for the toolkit to separate the bars and determine their relative sizes.
Tip 16: Try setting NoiseReduction to a value between 10 and 20.
Lines and Other Marks too Close to the Barcode
 Most barcodes should have a quiet zone around the barcode to distinguish the barcode from the rest of the image; however, as in the example below, it’s not unusual for barcodes to be printed in boxes which interfere and may result in the barcode being ignored by the toolkit.
Tip 17: Try setting the LineJump property. The LineJump controls the frequency with which the toolkit samples scan lines as it moves through an image. Decreasing the value of the LineJump property decreases the speed at which an image is processed, but may increase the barcode recognition rate.
Tip 18: You may also need to decrease the value of SkewLineJump to a value such as 1 though this will slow down the recognition speed. The SkewLineJump property controls the frequency with which the toolkit samples scan lines as it moves through an image. Increasing the value of the LineJump property will increase the speed at which an image is processed but may decrease the read rate.
Tip 19: Try setting the MaxLength. MaxLength defines the largest length for a barcode string, including checksum characters.
Tip 20: Try setting the MinLength. MinLength defines the smallest length for a barcode string, including checksum characters.


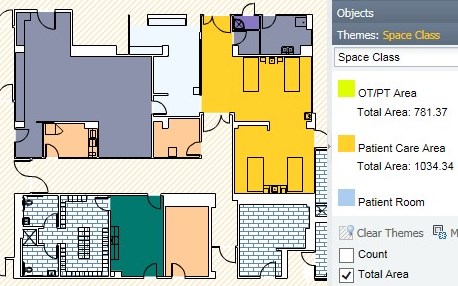
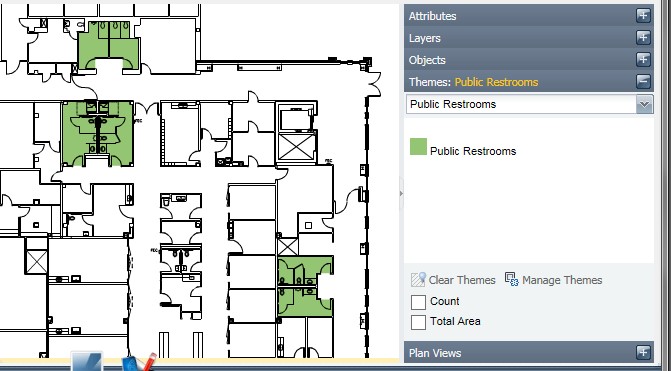
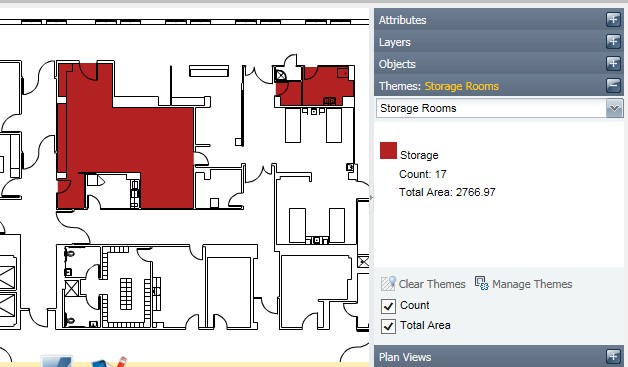
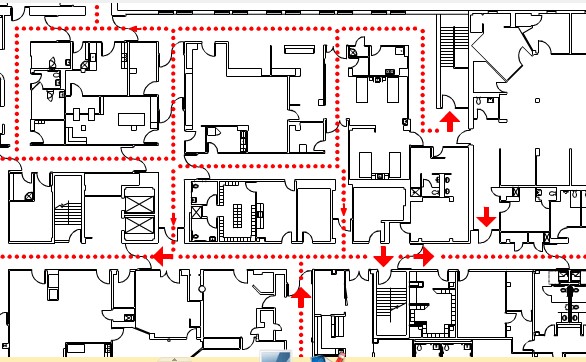

 Putting Healthcare Environmental Services Data to Work for You

 New Technologies in Surface Disinfection